
Table of Contents
- The Provisioning Ratchet
- Environment Proliferation
- Missing Ownership and Attribution
- The Taxonomy of Cloud Waste
- Designing a Tagging Taxonomy
- Exporting Billing Data for Analysis
- Unit Economics: Connecting Infrastructure Cost to Business Outcomes
- Environment Lifecycle Automation
- Budget Alerts and Anomaly Detection
- Integrating Cost into CI/CD
- Compute Rightsizing
- Database Rightsizing
- Storage Tier Optimization
- The Commitment Decision Framework
- AWS Savings Plans vs. Reserved Instances
- Purchasing Cadence and Governance
- Key Metrics to Track
- The FinOps Maturity Model
- Structuring FinOps Ownership
A technical guide to applied FinOps: visibility, governance, and optimization in practice
Cloud infrastructure is no longer a capital expenditure problem; it is an operational discipline problem. Compute, storage, and managed services are available on demand, and the marginal cost of spinning up a new environment is effectively zero. That accessibility is exactly what makes cloud spend so difficult to control: the feedback loop between engineering decisions and financial outcomes is weak, asynchronous, and opaque by default.
This guide is written for founders and engineering leaders who have moved past the "we'll optimize later" phase and are now confronting a cloud bill that doesn't map cleanly to business value. The content is technical and specific. It does not rehash the FinOps Foundation's framework definitions; it explains how to implement the practices that actually move the needle, tagging strategies that survive team growth, rightsizing heuristics you can act on, reservation logic tied to real workload data, and the metrics that matter to investors.
The core argument is simple: cloud cost control and engineering velocity are not in tension. Poorly instrumented infrastructure creates its own frictions, surprise bill reviews, emergency optimization sprints, and constrained capacity planning. The practices in this guide reduce that friction by making cost a first-class signal in your engineering workflow.
Why Startups Overspend
Most cloud cost guides start with the waste categories: idle instances, unattached volumes, and over-provisioned databases. Those are symptoms. The underlying causes are structural, and solving them requires addressing the structure, not just the bill.
The Provisioning Ratchet
Engineers provision for worst-case load because the cost of being wrong in the "under-provisioned" direction is visible (latency, errors, on-call pages) while the cost of being wrong in the "over-provisioned" direction is invisible (a line on a monthly invoice no one reviews). This creates a ratchet: instances get sized up under load, and never sized back down once the load subsides. The median AWS instance runs at 8–12% CPU utilization (per AWS's own Compute Optimizer data). In practice, that means a significant portion of most startups' compute bills represents provisioning headroom that is never consumed.
Insight: The problem isn't that engineers make bad decisions. It's that the feedback signal the cloud bill arrives 30 days late and with insufficient granularity to inform the original decision.
Environment Proliferation
Staging, QA, performance, sandbox, and demo: these environments tend to multiply and persist. Each represents infrastructure that runs around the clock regardless of whether anyone is using it. A representative pattern: a 20-person engineering team might have 6–8 non-production environments, each running at 30–60% the size of production, 24 hours a day, 7 days a week. That is potentially 40–60% of the production bill spent on infrastructure that is actively used for perhaps 8 hours per business day.
The fix is not to eliminate these environments; they serve real purposes, but to treat them as ephemeral by default. Infrastructure-as-code makes it feasible to spin an environment up in minutes; the cost discipline problem is building the organizational habit to do so rather than leaving environments running indefinitely.
Missing Ownership and Attribution
When cloud spend is not attributed to teams, features, or products, no one has standing to optimize it. Finance sees a lump sum. Engineering sees a collection of resources. Neither can answer the question "Is this spending justified?" without significant manual investigation. Attribution is a prerequisite for accountability, and accountability is a prerequisite for optimization.
The Taxonomy of Cloud Waste
The table below maps common waste categories to their detection methods. Each of these can be identified programmatically; there is no reason to do this manually.
Waste Category | Common Cause | Detection Method |
Idle Compute | Forgotten dev/test instances | CPU < 5% utilization over 14 days (CloudWatch / Azure Monitor) |
Over-provisioned Instances | Safety buffer provisioning | AWS Compute Optimizer or GCP Recommender flags; consistent p95 CPU < 30% |
Zombie Snapshots & Storage | No automated lifecycle policies | Unattached EBS volumes; S3 objects in Standard tier older than 90 days with zero GETs |
License Bleed | Bring-your-own-license mismatches | AWS License Manager; mismatches between running instances and license assignments |
Egress Amplification | Cross-region data replication, chatty APIs | VPC Flow Logs filtered on inter-region traffic; cost spike correlated with deploy events |
Untagged Resources | No tagging governance enforced | AWS Tag Editor / GCP Asset Inventory; cost attribution gaps in billing exports |
Cloud Waste Taxonomy: categories, causes, and programmatic detection methods
Building a Cost Attribution System That Scales
Visibility is not a dashboard; it is an attribution system. The distinction matters. A dashboard without accurate attribution shows you that you have a problem; attribution tells you whose problem it is and why. Building this requires three layers: a tagging taxonomy, enforcement infrastructure, and a cost reporting pipeline.
Designing a Tagging Taxonomy
A tagging taxonomy is a controlled vocabulary for classifying cloud resources. It needs to be simple enough that engineers follow it without friction, and structured enough that finance can run P&L allocations from it. The following schema works across AWS, GCP, and Azure:
Tag Key | Example Value | Purpose |
env | prod | staging | dev | Separate production cost from non-production spend |
team | platform | data | growth | Attribute the spend to the owning team for chargebacks |
service | payment-service | ingest-pipeline | Map infrastructure to microservices in the cost view |
cost-center | CC-1042 | Align to finance GL codes for accurate P&L allocation |
managed-by | terraform | pulumi | manual | Identify unmanaged (shadow) resources |
ttl | 2024-09-30 | Drive automated cleanup of ephemeral environments |
Recommended Tagging Schema keys, example values, and business purpose
Two implementation notes that are often overlooked:
Tag inheritance does not work the way most engineers expect. In AWS, resources launched by Auto Scaling Groups inherit the ASG's tags only if you explicitly configure it. EBS volumes created on instance launch inherit instance tags only if you enable the option. Audit your tagging completeness with AWS Tag Editor or the equivalent GCP Asset Inventory export; most organizations discover 20–40% of resources are untagged on the first audit.
Enforce tagging at resource creation time via Service Control Policies (AWS Organizations) or Organization Policies (GCP). A policy that prevents resource creation without required tags is more effective than any remediation process.
Exporting Billing Data for Analysis
Native cost consoles are useful for ad-hoc investigation but inadequate for programmatic reporting. The correct pattern is to export billing data to a queryable store and build reports against that.
On AWS, enable the Cost and Usage Report (CUR) with resource-level granularity and export it to S3 in Parquet format. From there, Athena or a data warehouse (Redshift, Snowflake, BigQuery) can query it directly. The CUR contains every line item, including amortized reserved instance and Savings Plan costs, resource tags at the time of billing, and blended vs. unblended cost breakdowns.
Unit Economics: Connecting Infrastructure Cost to Business Outcomes
The most powerful visibility practice is connecting cloud cost to product metrics. This requires instrumenting your application to emit usage events (transactions processed, users served, jobs executed) and joining those metrics with your billing data.
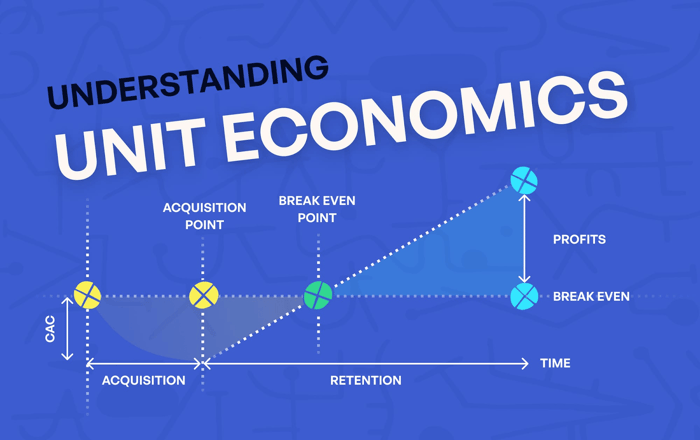
Concretely: if your payment service processes 2.4 million transactions per month and the infrastructure supporting it costs $18,000/month, your cost per transaction is $0.0075. That metric can then be tracked over time, benchmarked against industry norms, and used to evaluate infrastructure changes ("this database migration reduced cost per transaction by 22%").
Automation: Guardrails That Don't Slow Engineering
Manual cost optimization is not sustainable past a team size of roughly 10 engineers. At that scale, the overhead of manual review exceeds the savings it produces, and it introduces friction that degrades engineering velocity. The answer is automation mechanisms that enforce cost-aware behavior without requiring human intervention on each decision.
Environment Lifecycle Automation
Non-production environments should have a defined lifecycle enforced by tooling. The implementation pattern:
Tag every non-production resource with a 'ttl' (time-to-live) tag at creation. The value is an ISO 8601 date representing the environment's intended expiry.
Deploy a Lambda function (or Cloud Function) on a daily schedule that queries for resources where the ttl tag is in the past. The function sends a Slack notification to the owning team 48 hours before expiry, then terminates or shuts down the resources if no renewal action is taken.
For development environments specifically, add a schedule-based stop policy: instances stop at 19:00 local time and restart at 08:00, triggered by EventBridge rules or GCP Cloud Scheduler. For an environment that runs 65 hours/week instead of 168, that alone reduces its compute cost by 61%.
Budget Alerts and Anomaly Detection
AWS Cost Anomaly Detection (and the equivalent GCP Budget Alerts with forecasting) uses ML to establish a spend baseline and alert when actual spend deviates significantly. This is categorically different from a static threshold alert: it adapts to growth patterns and distinguishes between expected cost increases (new service launch, user growth) and unexpected spikes (runaway Lambda, misconfigured Auto Scaling).
Configure anomaly monitors at three levels: the total account, per service (EC2, RDS, data transfer), and per cost allocation tag (per-team). Alert thresholds: absolute ($) for account-level, percentage deviation for service- and team-level. Route alerts to the owning team's Slack channel, not a central #ops channel. Ownership is the point.
Rule of thumb: If your team cannot identify the cause of a cost anomaly within 2 hours of the alert, your tagging taxonomy is not granular enough.
Integrating Cost into CI/CD
Infrastructure changes that significantly increase cost should be flagged before they reach production. This is achievable with Infracost (open source), which integrates with Terraform, Pulumi, and CDK to produce a cost estimate diff in pull requests.
This gate does not require approval for every infrastructure change, only those above the defined threshold. Engineers retain autonomy on small changes; significant cost implications trigger a conversation.
Rightsizing: Practical Heuristics for Compute, Database, and Storage
Rightsizing is the practice of matching resource capacity to actual workload requirements. It is the highest-ROI FinOps activity for most startups because over-provisioning is systematic, and the corrections are straightforward once you have the data.
Compute Rightsizing
The rightsizing decision requires two inputs: utilization data over a representative period (minimum 14 days, ideally 30), and an understanding of your application's scaling characteristics (CPU-bound vs. memory-bound, latency-sensitive vs. throughput-optimized).
AWS Compute Optimizer provides per-instance recommendations automatically. For teams not on AWS, the heuristic is:
If p95 CPU < 20% and p95 memory < 50% consistently: rightsize down one instance family step (e.g., m6i.xlarge → m6i.large). Run at the smaller size for 7 days with monitoring before committing.
If the workload is network I/O intensive rather than compute intensive, evaluate network-optimized families (c6gn, m6in on AWS), which offer higher baseline bandwidth at similar compute pricing.
If the workload is memory-bound (e.g., in-memory caching, JVM heap): evaluate memory-optimized families (r6i, r6g) rather than general-purpose, which can be cheaper per GB of RAM.
Graviton (ARM) instances offer 10–20% better price/performance on most general-purpose workloads. Migration requires validating that your runtime (JVM, Python, Go, Node) and compiled dependencies are ARM-compatible. For most modern stacks, they are.
Database Rightsizing
Database rightsizing carries more operational risk than compute rightsizing because storage and compute are coupled, and resize operations often involve downtime or failover. The practical approach:
Storage: RDS storage autoscaling prevents under-provisioning but does not downsize. Review provisioned storage vs. actual usage quarterly. If actual usage is consistently below 60% of provisioned storage, the instance was sized for projected growth that hasn't materialised, right-size before the next commit purchase.
Multi-AZ in non-production: Standby replicas in dev and staging environments serve no operational purpose. Disabling Multi-AZ in non-production databases reduces their cost by approximately 50%. This single change is often worth $500–2,000/month for mid-stage startups.
Read replicas: If read replicas were provisioned for anticipated read load, validate that they are actually receiving queries via CloudWatch RDS ReadIOPS. A read replica with minimal traffic is a candidate for removal or consolidation.
Storage Tier Optimization
Object storage (S3, GCS) costs accumulate through two mechanisms: storage volume and request/retrieval fees. Lifecycle policies address the former; access pattern analysis addresses the latter.
The tradeoff is retrieval latency (milliseconds vs. seconds) and retrieval fees. For logs and archives that are accessed rarely, the economics are clear. Apply similar logic to database backups, build artifacts, and ML training datasets.
Commitment Discounts: When to Buy and What to Buy
Reserved Instances (RIs) and Savings Plans are the largest single lever available to reduce cloud spend, delivering 30–70% discounts relative to on-demand pricing in exchange for a usage commitment. Most startups leave significant savings on the table here, either because they are uncertain about their workload stability or because they don't understand the product structure.
The Commitment Decision Framework
The core question is not "should we buy commitments" but "how much of our on-demand spend is stable enough to commit to." The answer requires analyzing your CloudTrail or billing history to identify your minimum sustained compute floor, the level of usage that was present every hour over the past 90 days, regardless of load variation.
That floor is your safe commitment target. You cannot be wrong in committing to usage you were already running. Any usage above the floor can remain on-demand or Spot.
AWS Savings Plans vs. Reserved Instances
For most AWS workloads, Compute Savings Plans are preferable to EC2 Reserved Instances because they automatically apply discounts across instance families, sizes, regions, and operating systems. The flexibility comes at a small cost: Convertible RIs offer slightly higher discounts for specific instance families, but lock you into that family for the commitment term.
The exception is managed services: RDS, ElastiCache, Redshift, and OpenSearch are not covered by Savings Plans. These require service-specific Reserved Instances and should be analyzed and purchased separately.
Purchase Model | Discount vs On-Demand | Flexibility | Best Fit |
On-Demand | Baseline (0%) | Full | Unpredictable or short-lived workloads |
1-yr Compute Savings Plan (AWS) | ~38–42% | High (any EC2 family, size, region) | Stable baseline compute; growing teams not ready to commit to instance types |
3-yr Compute Savings Plan (AWS) | ~58–66% | High | Mature workloads with predictable spend and multi-year runways |
Reserved Instance (Convertible) | ~45–54% | Medium (can change family) | RDS, ElastiCache, Redshift—services not covered by Savings Plans |
Spot / Preemptible | ~60–90% | Low (can be reclaimed) | Fault-tolerant batch, ML training, CI runners with graceful interruption handling |
GCP Committed Use Discount | ~28–57% | Medium | GKE node pools and Cloud SQL with predictable vCPU/memory needs |
Commitment Model Comparison: discount rates, flexibility, and optimal use cases
Purchasing Cadence and Governance
Commitment purchases should be a quarterly governance process, not an ad-hoc decision. The process:
At the start of each quarter, run a coverage analysis: what percentage of your on-demand eligible spend was covered by commitments in the prior quarter?
Identify the gap. For stable workloads where coverage is below 70%, calculate the cost of purchasing additional 1-year Compute Savings Plans to close the gap.
For workloads that have been stable for 12+ months and show no sign of architectural change, evaluate 3-year commitments for a portion of the baseline. The payback period on 3-year commitments relative to 1-year is typically 18–24 months.
Document the purchase rationale. When you're explaining infrastructure costs to a board or investor, being able to show a deliberate commitment strategy is qualitatively different from showing ad-hoc, on-demand spend.
Metrics, Maturity, and Organizational Design
FinOps is not a one-time optimisation exercise; it is an ongoing operational function. The practices that work for a 10-person team are inadequate at 50 people, and the tooling appropriate for a seed-stage startup is different from what a Series B company needs. Maturity models exist for this reason: they define what "good" looks like at each stage of growth.
Key Metrics to Track
Metric | Formula | What It Tells You |
Cloud Spend / Revenue | Monthly cloud cost ÷ MRR | Infrastructure margin health; benchmark: < 10–15% for SaaS at scale |
Cost per Active User (CPU) | Monthly cloud cost ÷ MAU | The efficiency signal should decrease as you scale (economies of infrastructure) |
Cost per Transaction | Infra cost attributed to service ÷ request count | Identify expensive API paths or pipelines before they hit margin |
Savings Realization Rate | Savings implemented ÷ Savings identified | FinOps execution health; < 50% signals organizational friction |
Coverage Ratio (RIs/SPs) | Committed spend ÷ Total eligible spend | Discount capture efficiency; target > 70% for stable workloads |
Untagged Resource % | Untagged resource count ÷ Total resources | Cost attribution quality drives the allocatable vs unallocatable cost split |
Core FinOps Metrics — definitions, formulas, and interpretive guidance
Of these, Cloud Spend as a Percentage of Revenue is the most important for investor communication. Benchmarks vary by business model: infrastructure-heavy B2C companies might run at 15–25% in early stages; B2B SaaS companies should target sub-10% at scale. What matters more than the absolute number is the trend; it should be declining as revenue grows, demonstrating infrastructure leverage.
The FinOps Maturity Model
Stage | Practices in Place | Tooling | Typical Trigger to Advance |
Crawl (0–18 months) | Basic tagging, monthly bill review, and manual rightsizing pass | Native console cost explorer | Cloud bill exceeds $10K/month or investor asks about unit economics |
Walk (Series A) | Tag enforcement via IaC, budget alerts, first RI/SP purchases, per-team dashboards | AWS Cost Explorer, CloudHealth, or Spot.io | Cloud spend reaches 20–25% of revenue or engineering headcount > 15 |
Run (Series B+) | Automated rightsizing, chargeback to product lines, FinOps lead hired, quarterly commitment reviews | Apptio Cloudability, Datadog Cloud Cost, or custom tooling | Multi-cloud footprint, board-level margin scrutiny, IPO readiness |
FinOps Maturity Model practices, tooling, and advancement triggers by stage
A common mistake is implementing the run-stage tooling at crawl-stage maturity. Sophisticated FinOps platforms (Cloudability, CloudHealth) require organisational infrastructure, tag governance, cross-team buy-in, and finance integration to produce value. Buying tooling before the organizational practices are in place produces dashboards that no one uses.
Structuring FinOps Ownership
In the earliest stages, the founder or engineering lead owns the cloud cost. As the company scales, this should transition to a shared responsibility model: engineering teams own their service-level costs; a platform or infrastructure team owns shared infrastructure costs; finance owns the top-line budget and forecasting. A FinOps lead, typically hired at Series B or when cloud spend exceeds $500K/year, bridges engineering and finance, owns the commitment strategy, and drives cross-team optimization programs.
Ownership principle: The team that generates the cost should have visibility into it and accountability for managing it. Centralizing cost ownership in finance or a platform team removes the incentive for product teams to design efficiently.
Conclusion
Cloud cost management is an engineering discipline, not a finance function. The practices described in this guide, systematic tagging, lifecycle automation, data-driven rightsizing, disciplined commitment purchasing, and unit economics instrumentation, are all things that engineering teams build and operate. Finance provides the budget context and business outcome targets; engineering determines how to hit those targets without compromising velocity.
The founders who manage this well don't do it by restricting engineering access or adding approval gates. They do it by making cost a legible, attributable signal in the same systems engineers already use: infrastructure-as-code, CI/CD pipelines, Slack alerts, and pull request reviews. When cost is visible and owned, it optimizes itself through the ordinary engineering process of improving systems over time.
Start with attribution. You cannot optimize what you cannot measure, and you cannot measure what you haven't tagged. Everything else follows.
Akava would love to help your organization adapt, evolve and innovate your modernization initiatives. If you’re looking to discuss, strategize or implement any of these processes, reach out to bd@akava.io and reference this post.